Quickstart#
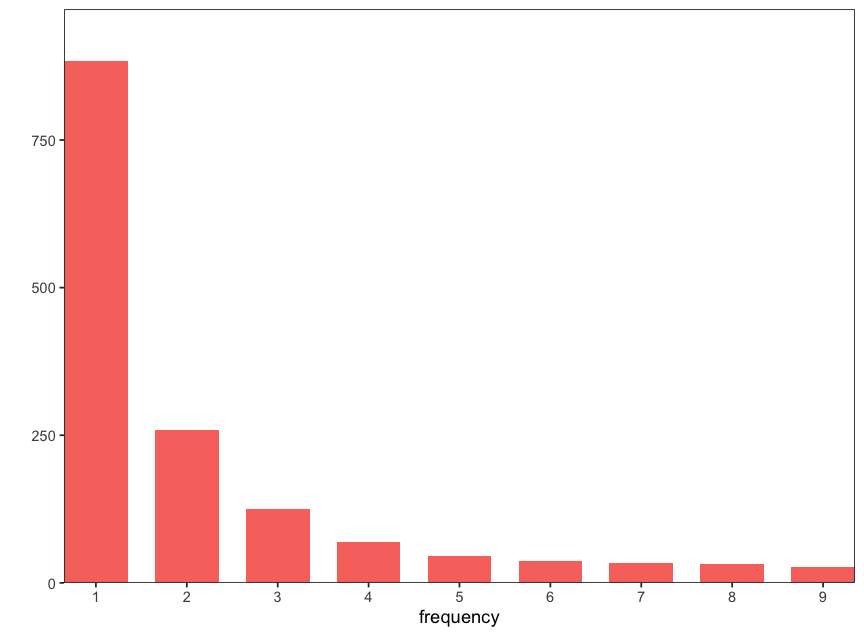
Parse a site-frequency spectrum from a polarised VCF and plot it. The example VCF for Betula spp. carries ancestral alleles in the AA info field, which the Parser uses to polarise each site. n is the sample size (number of haplotypes) the spectrum is projected to.
library(sfsutils)

su <- load_sfsutils()
vcf <- "resources/genome/betula/biallelic.polarized.subset.10000.vcf.gz"

sfs <- su$Parser(n = 10, source = vcf)$parse()
INFO:Parser: Using stratification: [all].
INFO:Parser: Loading VCF file
Parser>Counting sites: 10000it [00:00, 388275.20it/s]
Parser>Processing sites: 100%|██████████| 10000/10000 [00:03<00:00, 3058.80it/s]
INFO:PolyAllelicFiltration: Filtered out 0 sites.
INFO:Parser: Skipped 401 sites without ancestral allele information.
INFO:Parser: Included 9599 out of 10000 sites in total from the input.
p <- sfs$plot()